


Product request
You are looking for a solution:

Select an option, and we will develop the best offer
for you


QoE vs QoS in IPTV: Why Operators Need More Than Network Monitoring
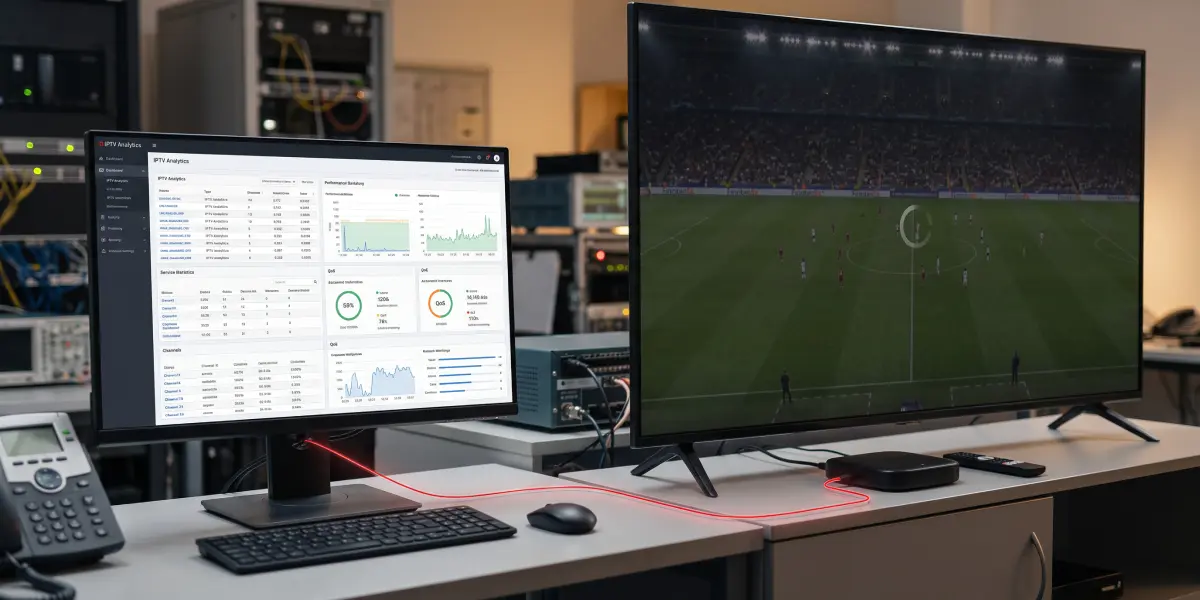
Every IPTV operator knows the situation: the network dashboard is green, packet loss is within acceptable limits, and latency looks normal–yet complaints keep coming in. Subscribers report that channels take too long to open, the picture freezes during a match, and the app feels sluggish. Comparing QoE and QoS metrics in IPTV explains this gap. Quality of Service (QoS) shows whether the network delivered the packets. Quality of Experience (QoE) shows whether the viewer actually received a fast start and smooth playback. In this article, we compare these two sets of metrics, examine what research says about viewer loyalty, and explain which QoE indicators belong alongside your network KPIs.
QoS and QoE: Two Different Questions
QoS and QoE are often used interchangeably, but they answer different questions.
QoS asks: did the network deliver? It is measured within the infrastructure–at the headend, core routers, distribution nodes, and access network. Typical indicators include packet loss, jitter, latency, and bandwidth.
QoE asks: did the viewer have a good experience? It is measured on the device being used–the set-top box, smart TV, or mobile app. Typical indicators include video startup time, rebuffering ratio, channel switching time, and playback errors.
Good QoS is a prerequisite for good QoE, not a guarantee. A stream can arrive with almost no packet loss and still start slowly because of delays in the CDN or middleware, a resource-heavy interface, or a player with an overly cautious buffering strategy. The reverse is also possible: the player’s buffer absorbs brief network disruptions, and the viewer never notices them. An operator that monitors only QoS therefore sees the network, but not what is happening on the subscriber’s device.
Comparison table: QoS and QoE metrics
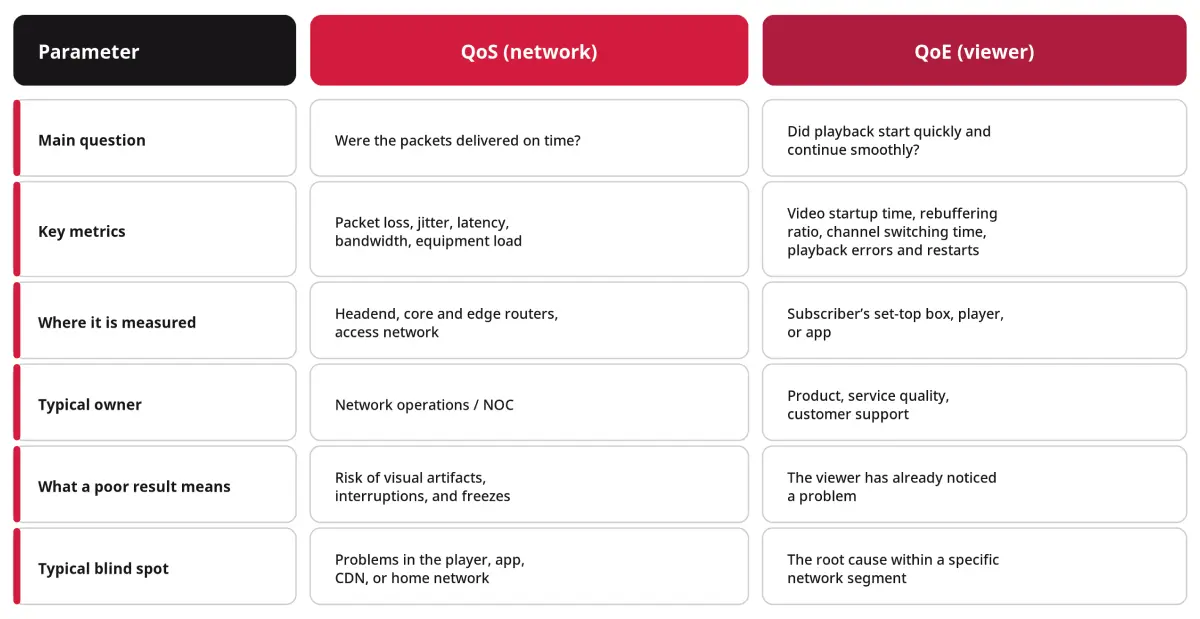
QoE vs QoS IPTV metrics along the delivery chain from headend to set-top box
A brief definition helps clarify one of the most important QoE metrics. The rebuffering ratio is the percentage of total viewing time spent waiting for playback to resume. Frequent rebuffering is a major cause of poor QoE and often drives viewers away. It also connects the two perspectives: a high or rising rebuffering ratio can indicate declining overall network performance, often revealing a network problem before the NOC sees a threshold alert.
Video startup time is the interval between a viewer’s action–selecting a channel or pressing Play–and the first frame appearing on screen. For live TV, a related metric is channel switching time, or zapping time: how long it takes to move from one channel to another. Neither appears on QoS dashboards, but viewers experience both every time they press a button.
What the Data Says About Viewer Loyalty
How much does a delay of one or two seconds really matter? One of the most widely cited studies on this topic is the work by Ramesh Sitaraman and S. Shunmuga Krishnan at the University of Massachusetts Amherst, using Akamai data. It covered 6.7 million unique viewers, 23 million video views, and 216 million minutes of viewing over 10 days.
Key findings:
- Viewers start abandoning a video if it does not begin playing within two seconds. Each additional second of startup delay increases abandonment by approximately 5.8%.
- A viewer whose video froze for 1% of the viewing time watched 5% fewer minutes than a comparable viewer who experienced smooth playback.
- Viewers who encountered a playback error were 2.3% less likely to return to the same website within a week.
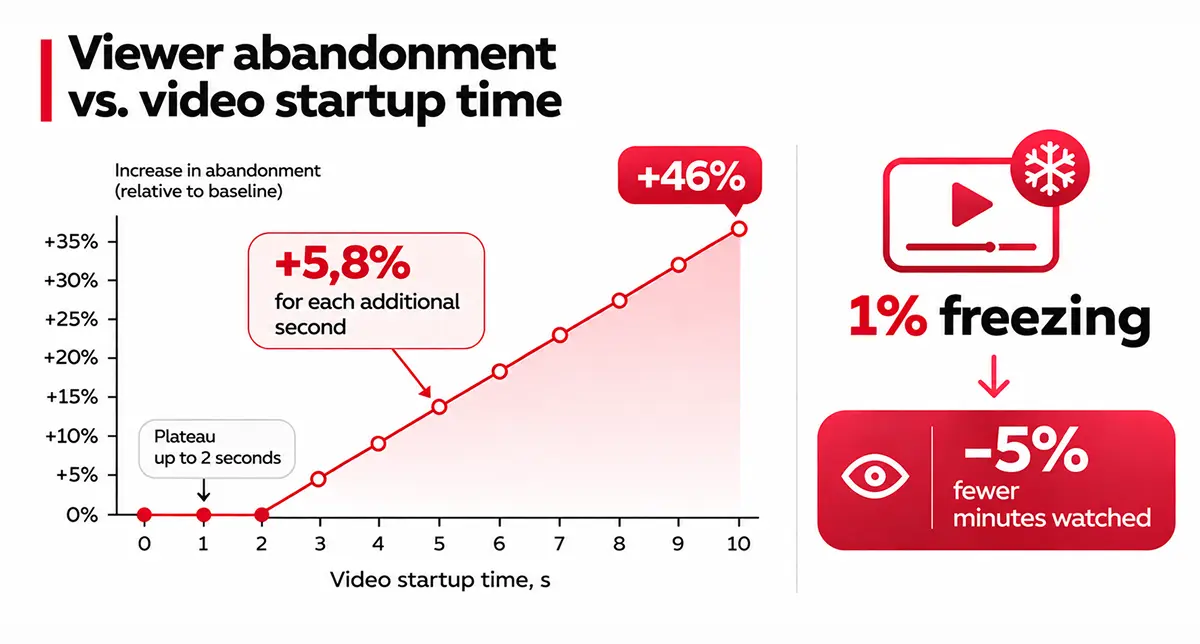
Video startup time and viewer abandonment, and the impact of rebuffering on minutes watched
Note: these findings date from 2012 and describe online video, not managed IPTV. Audience expectations are unlikely to have fallen since then, but the exact figures for your service will differ. Use them as an indication of the direction and scale of the effect, rather than a forecast for your subscriber base. The study’s real value lies in the principle it demonstrates: viewers react to changes in their experience within seconds, long before a network problem appears in a weekly report.
From Quality to Churn
In IPTV, a poor experience rarely ends with a single abandoned viewing session. It builds up over time. As we noted in our article on IPTV retention strategies, viewers react immediately to buffering, freezes, and stream interruptions, while repeated support requests can be early warning signs of churn.
The sequence usually looks like this:
- The experience deteriorates: channels start more slowly, brief freezes appear during evening peak hours, and playback errors occur occasionally.
- The viewer adapts: they watch less, switch to other apps on the same TV, or stop using catch-up or VOD.
- The viewer complains: first one support request, then repeated contacts.
- The viewer leaves: often at the end of the billing period, sometimes without making a final complaint.
QoS monitoring typically diagnoses a problem at step 1 only if the cause is network-related and a threshold has been crossed. QoE monitoring detects it at step 1 regardless of the cause, creating an opportunity to act before step 3. This is where reducing IPTV churn becomes a measurable task: if you know which subscribers have experienced high rebuffering ratios or slow startup times this week, support can contact them proactively instead of waiting for a call.
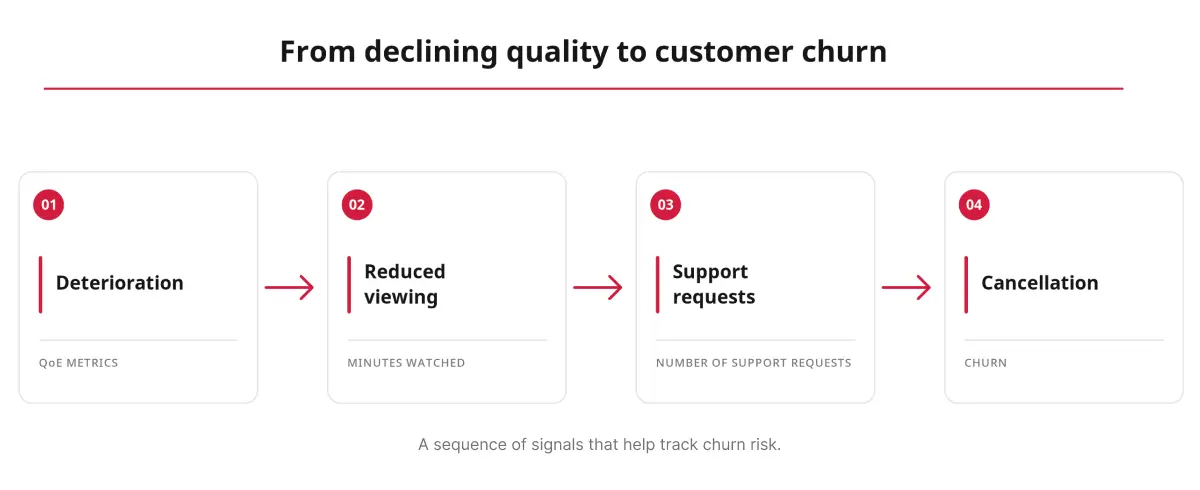
How poor IPTV quality of experience leads to subscriber churn
How to Integrate QoE Monitoring into an IPTV Service
IPTV quality of experience monitoring does not replace network monitoring–it complements it. The goal is end-to-end IPTV monitoring, where the same incident is visible from both the network’s and the viewer’s perspective. In practice, this relies on three elements.
1. Device-level data. QoE can only be measured where the picture is displayed, so the set-top box becomes a sensor. Useful set-top box analytics include startup and channel switching times, buffering events, player restarts, unexpected playback stops, and authorization errors. Client telemetry–player restarts, playback stops, and slow EPG loading–also helps teams pinpoint problems faster. Device consistency matters too: automatic set-top box firmware updates maintain consistent player behavior across the fleet, so changes in QoE reflect the service rather than a mix of outdated software versions.
2. KPI reports that bring both perspectives together. QoE data is useful only when it can be compared with network KPIs and business metrics in a single view. For operators using Ministra PRO, the middleware provides data on key IPTV service performance indicators in one report. A good practice is to group subscriber experience metrics by region, network segment, device model, and time of day. A spike in rebuffering can then immediately indicate where the problem lies.
3. Alert thresholds tied to the viewer, not just the equipment. Network alerts are usually configured around packet loss, link utilization, or device load. Add experience-based alerts–for example, a rising share of sessions with startup times above your target, or an increasing rebuffering ratio in a particular segment. The study discussed above suggests that two seconds is a reasonable reference point for startup time; exact thresholds should be set against your own baseline.
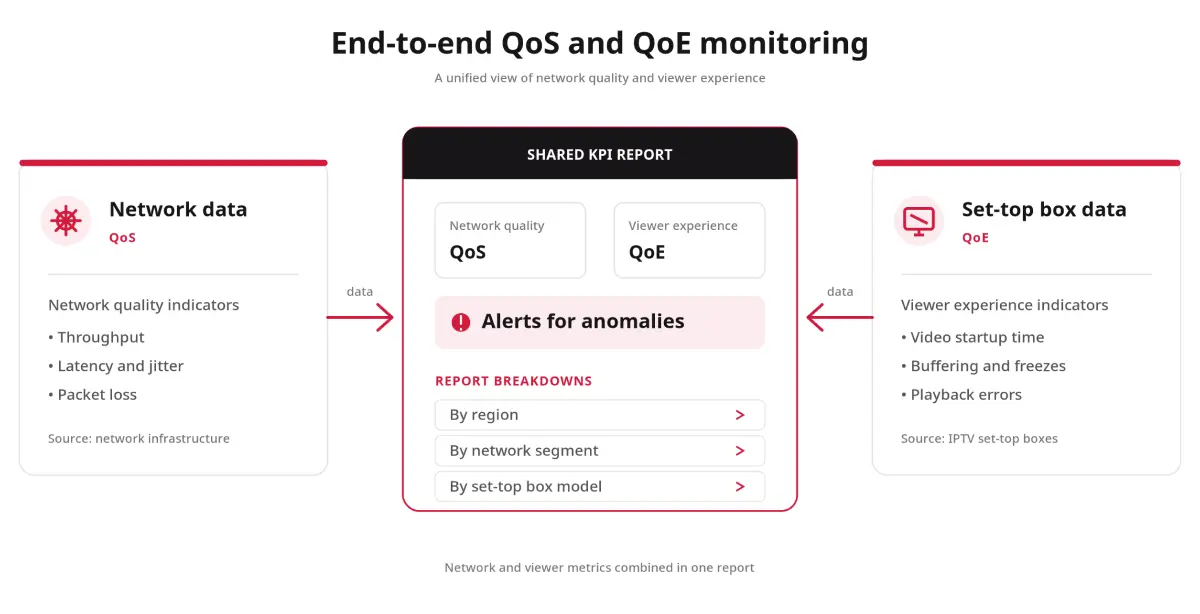
End-to-end IPTV monitoring combining network QoS and set-top box QoE data
Equipment selection also affects the experience. When choosing devices for deployment, consider not only price and codec support but also boot speed, channel switching performance, Wi-Fi operation, and firmware support. Our guide on how to choose an IPTV set-top box outlines the criteria integrators use.
FAQ
What is the difference between QoS and QoE in IPTV?
QoS measures how well the network delivers the stream through packet loss, jitter, latency, and bandwidth. QoE provides data on what viewers actually experience: how quickly playback starts, how often it freezes, how quickly channels switch, and how often errors occur.
Why do subscribers complain when QoS is normal?
Because many problems occur outside the network core: in the CDN or middleware, the player, the app, the home Wi-Fi network, or the device itself. Network metrics may remain within their thresholds while viewers still wait for a channel to open or experience freezes.
Which QoE metrics matter most to IPTV operators?
Video startup time, channel switching time, rebuffering ratio, and the frequency of playback errors and restarts. Together, they show whether users experience the service as fast and stable.
How does startup delay affect viewer abandonment?
In the University of Massachusetts Amherst study using Akamai data, viewers started abandoning videos that did not begin playing within two seconds, and each additional second increased abandonment by approximately 5.8%. The findings concern online video in 2012, so treat them as a reference point rather than an exact forecast for IPTV.
How can QoE be measured on a set-top box?
The set-top box or app collects playback events–startup time, buffering data, errors, and restarts–and sends them to the operator’s platform, where they are aggregated into reports and alerts by region, network segment, and device model.
How does QoE monitoring reduce churn?
It reveals experience problems before they turn into repeated complaints. When the team knows which subscribers or segments are experiencing slow startup or frequent rebuffering, it can address the cause or contact subscribers proactively, before they decide to leave.
Recommended
IPTV Security: How Ministra PRO Protects Your IPTV Platform
The security of an IPTV service depends on more than protecting the video stream. A vulnerability in a server component can put platform availability, subscriber data, and content access management at risk. IPTV security therefore requires infrastructure updates, API protection, and playback controls working together.

Observability in IPTV: Which Metrics Operators Need to Monitor to Identify Problems Quickly
For an IPTV/OTT operator, service stability depends on more than the availability of servers and channels. The platform may be running without critical errors and the CDN is delivering the video stream successfully, but users still experience slow stream startup, buffering, or denied access to content.

Why RDK Is Becoming a Key Platform for Operator TV
Choosing an interactive TV platform determines more than just the appearance of menus and the apps available. It also affects how difficult it is to add new set-top box models, update software, troubleshoot problems, and switch hardware suppliers.