


Product request
You are looking for a solution:

Select an option, and we will develop the best offer
for you


Observability in IPTV: Which Metrics Operators Need to Monitor to Identify Problems Quickly
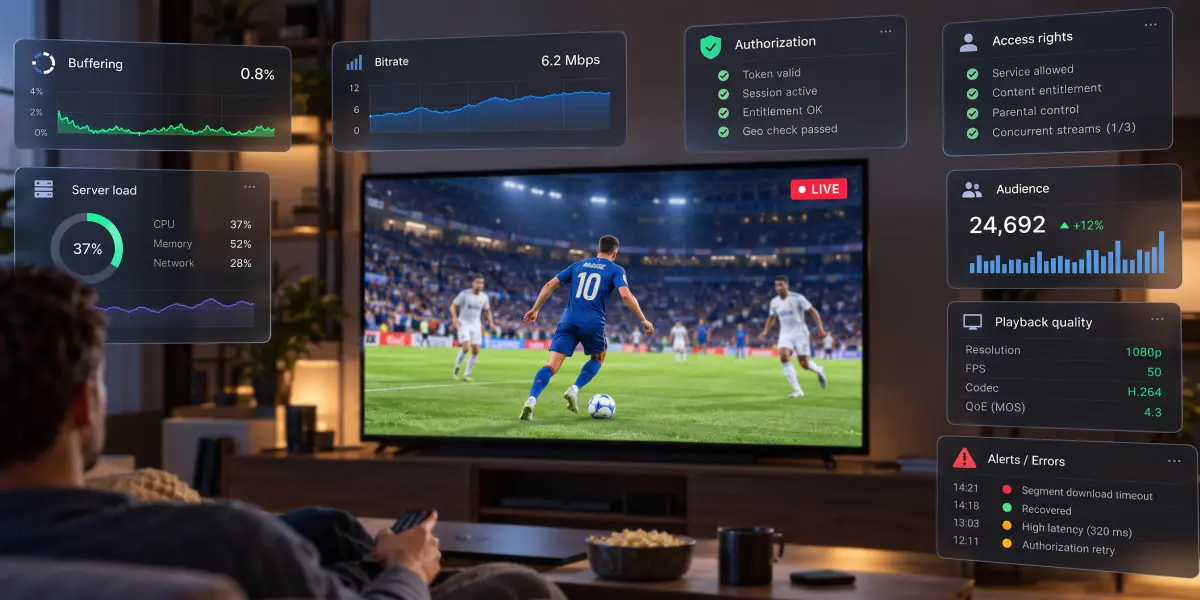
For an IPTV/OTT operator, service stability depends on more than the availability of servers and channels. The platform may be running without critical errors and the CDN is delivering the video stream successfully, but users still experience slow stream startup, buffering, or denied access to content.
If monitoring only shows the state of the infrastructure, the technical team learns about these problems from subscribers.
The scale of this challenge is confirmed by data from 2026. According to the Bitmovin Video Developer Report 2026/27, based on responses from 486 professionals across 94 countries, only 9% of teams identify the root cause of streaming problems in less than an hour. For 29%, the process takes between 12 and 24 hours. Meanwhile, 28% of respondents identify continuous monitoring and IPTV analytics as one of the industry's main challenges, while 27% point to identifying the root causes of failures.
For operators, this means that simply collecting more technical data is not enough. They need to connect server status, middleware operation, video delivery, and user actions into a single picture. This is precisely the purpose of observability in an IPTV/OTT service.
How Observability Differs from Traditional Monitoring
Traditional IPTV monitoring answers predefined questions: Is the server available? How many resources is it using? Is the API working? Has the acceptable load threshold been exceeded? While this is necessary, it doesn't always explain why a TV channel has stopped launching for a particular group of subscribers.
Observability makes it possible to investigate the behavior of the entire system using video streaming performance metrics, event logs, and data showing how requests travel between components. The goal is not only to detect an anomaly, but also to trace the connection between its cause and the result experienced by the viewer.
For example, a complaint that "the channel won't open" may indicate several different problems. In this instance, the user's subscription may have expired, the device may have failed authorization, the middleware may have provided an incorrect URL, the DRM server may have denied a license, or the CDN may have failed to deliver a segment.
The symptom is the same, but the components responsible and the actions required from the technical team differ.
IPTV observability should therefore be built around the complete user journey: opening the application, checking access rights, retrieving the channel list, selecting content, starting the stream, and continuing playback. Operators need specific metrics at each stage.
User Experience Metrics: What Happens During Playback
The first level of observability is playback quality, or QoE (Quality of Experience). The data from video QoE shows what the user actually received, not what the infrastructure was supposed to deliver.
The primary metrics operators need are video startup success rate, time to first frame, buffering frequency and duration, playback failures, and actual delivered bitrate.
Video startup time should be measured from the user's action to the appearance of the first frame. It's useful to track not only the average value but also the 95th percentile, which shows the time within which 95% of measured sessions start. This helps reveal problems that may be hidden behind an acceptable average.
Startup errors and playback errors should be treated separately. In the first case, the user was unable to start watching. In the second, playback started but was subsequently interrupted. These are different diagnostic scenarios with potentially different causes.
Buffering is evaluated by the proportion of sessions with interruptions, the number of interruptions, and the ratio of buffering time to total viewing time. Using video QoE metrics, it's also useful to see whether bitrate decreases during a session. If the adaptive player continuously switches to a lower quality level, the absence of playback interruptions doesn't necessarily mean that the service is performing well.
In Bitmovin's 2026 study, buffering events and error rate were the most commonly tracked QoE metrics, reported by 57% and 43% of respondents, respectively.
These metrics are particularly valuable when broken down by set-top box model, application version, operating system, region, internet service provider, and individual channel. Overall statistics may appear normal even when a new application version causes problems for a significant proportion of users with a particular device model.
Accurate buffering, decoding, and playback quality metrics must come from the player or client application. Central server logs alone can't reliably reconstruct everything that happened on the subscriber's screen.
Authorization and Middleware: Where Failures Begin
The second level covers access management and server platform operation. Even a fully functional video delivery system can't help users if they're unable to log in to the application, retrieve the channel list, or confirm their viewing rights.
Operators need to monitor the number of successful and failed authorizations, request processing latency, API errors, active sessions, billing integration status, and the results of subscription plan restriction checks.
Changes in error rates are particularly important. For example, a sudden increase in authorization failures after subscription plan changes may indicate a problem with package configuration or synchronization with an external system rather than a device malfunction.
CDN and Delivery Servers: How to Identify the Source of Stream Problems
The third level of observability covers the video delivery path from the central server to the user's device. Operators need to see both the total volume of traffic and the behavior of individual delivery components.
For the central server, important metrics include CPU, memory, disk subsystem, and network interface utilization, request volume, response time, and error rate. For the CDN, they include outgoing traffic, cache hit ratio, segment retrieval errors, response latency, and load distribution across nodes.
It's especially important to distinguish between central server and CDN failures. If users in one region experience widespread buffering while playback remains stable elsewhere, the cause may be a specific edge node or network route. If errors occur simultaneously across all regions, the central delivery infrastructure, video sources, and shared dependencies should be checked.
When multiple streamers are used, operators should also monitor stream availability on each server, the number of active sessions, and load-balancing results.
Ministra PRO supports TV channel availability checks on streaming servers and load balancing between them. When multiple servers are used, the platform can display channel availability check results, helping the technical team identify a possible source of stream latency or buffering: a stream URL, a streaming server, or load distribution settings.
To analyze CDN status, network interface utilization, and video segment delivery, operators need to supplement middleware data with information from monitoring systems covering the relevant infrastructure components.
How to Correlate Metrics and Quickly Identify the Root Cause
The main value of observability becomes apparent when operators can correlate data from different components within the same time window.
For each event, it's useful to associate its timestamp with a session ID, account or anonymized user ID, device, application version, channel, stream URL, and delivery server. If the architecture allows it, requests between middleware, APIs, and external services should share a common trace ID.
This significantly reduces manual work. Instead of examining several independent logs one after another, engineers can reconstruct the sequence of events that preceded an error.
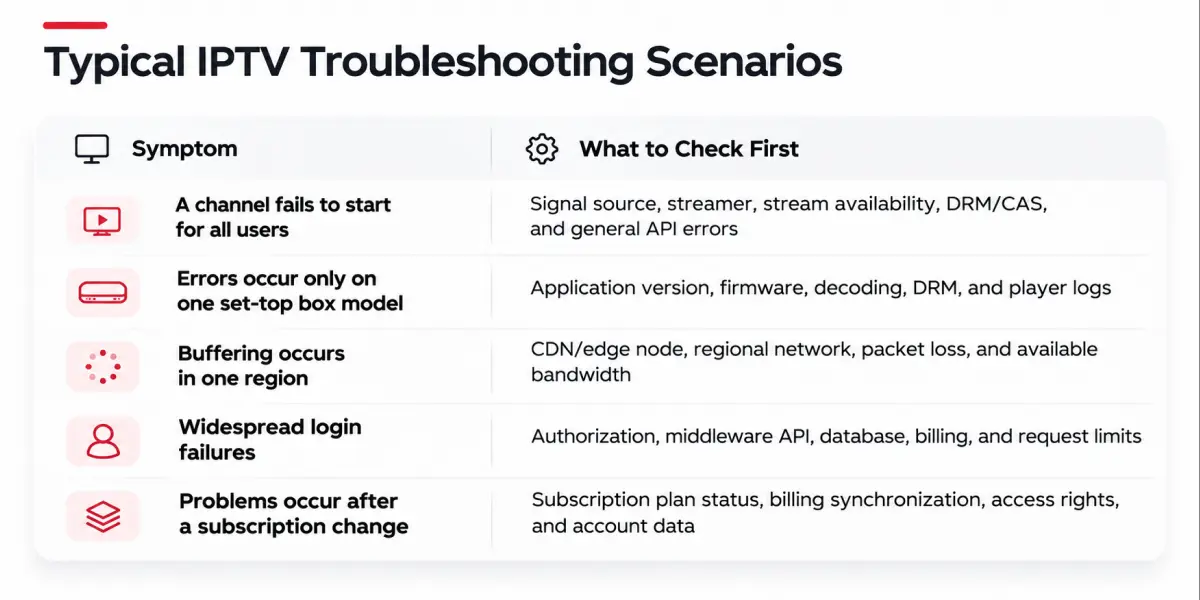
These are initial areas to investigate, not automatic root cause diagnoses. The final conclusion must be supported by events and metrics.
For example, after an application update, the startup error rate increases only on set-top boxes running a particular firmware version. Overall server availability remains normal. By breaking down metrics by device model and software version, the team can isolate the problem at the client level without spending time reconfiguring the CDN.
Another example: during a football match, both channel startup time and the number of authorization errors increase. If middleware API response latency also rises while CDN bandwidth remains within normal limits, the initial investigation should focus on the server platform and related services rather than the video delivery infrastructure.
What an Operator's Dashboard Should Show
Observability doesn't require placing hundreds of charts on a single dashboard. The operations team needs a screen that allows them to determine the scale of a problem within seconds and then drill down into the details.
What IPTV operators should monitor in real time is a minimum set of metrics for the main video streaming analytics dashboard. These can be divided into six groups:
- Audience: active sessions, concurrent viewers, distribution by channel, region, and device.
- Playback: startup success rate, time to first frame, player errors, buffering frequency, and actual bitrate.
- Access: authorization success rate, middleware API errors, response latency, and billing integration failures.
- Delivery: stream availability, streamer status, CDN load, segment errors, and cache hit ratio.
- Infrastructure: server and database utilization, network link status, and availability of critical components.
- Incident response: active incidents, support requests, detection time, and time to resolution.
It's important to be able to filter these key video streaming performance metrics by time, region, channel, application, and device model. Without these filters, an overall dashboard may show the state of the service but not provide enough information to investigate a specific problem.
Alerts also deserve particular attention. The system should primarily respond to anomalies that directly affect viewing: an increase in startup errors, growing buffering rates, the unavailability of a popular channel, or widespread authorization failures.
The same alert thresholds cannot be applied to every service. Normal load characteristics differ between a local IPTV operator, a hotel network, and a large OTT platform. Alerts should therefore be configured using historical baselines and target quality requirements, then adjusted based on the results of real incidents.
How to Implement Observability Without Unnecessary Costs
The starting point shouldn't be purchasing another video streaming monitoring tool, but reviewing the data the operator already collects.
First, map the main user operations and identify which components are involved in each one. Then check where event logs and metrics are already available and where information is missing.
For example, middleware may record the start of playback and a player error without showing the cause of a video segment retrieval problem. The CDN has data on delivery latency but doesn't have complete information about the user's subscription plan. The billing system records subscription changes but doesn't necessarily see their effect on the client device.
The purpose of observability is to connect these sources, not replace them with a single platform.
The next step is to select several critical scenarios: mass authorization, launching a popular TV channel, VoD playback, switching between channels, and recovery after a lost connection.
For each scenario, define expected behavior, required metrics, data sources, and diagnostic procedures in advance. Shared dashboards and alerts can then be configured.
Implementation results should be evaluated by operational indicators: mean time to detect a problem (MTTD), mean time to restore service (MTTR), the proportion of incidents detected before subscribers report them, and the number of recurring errors.
Observability in IPTV means connecting the technical state of the platform with the viewer's actual experience. For operators, what matters is not individual charts showing server utilization, but using video streaming analytics to understand exactly where the journey from opening an application to stable playback breaks down.
Ministra PRO helps monitor user events, content access, channel status, and service logic. Combined with telemetry from players, CDNs, streamers, and networks, this data enables teams to isolate failures more quickly, identify responsibility for resolving problems more accurately, and reduce service restoration time.
Recommended

Why RDK Is Becoming a Key Platform for Operator TV
Choosing an interactive TV platform determines more than just the appearance of menus and the apps available. It also affects how difficult it is to add new set-top box models, update software, troubleshoot problems, and switch hardware suppliers.

AI in IPTV/OTT Without the Hype: Where It Really Helps Operators and Where It Still Gets in the Way
Artificial intelligence is already being used in video services for content recommendations, viewer behaviour analytics, automated video processing, and technical diagnostics.

Building a Partner Network: How to Expand Middleware Presence Across Regions
For an IPTV operator, middleware has long since become more than just the technical core of a service. It's the layer through which the operator manages users, devices, tariffs, channels, VoD, EPG, access rights, events, billing integrations, and client applications.